Nine months of AI-based control optimization on a modern office building HVAC
Foobot Smart Air Building (SAB) project
In October last year, SAB artificial intelligent agents took control over a 15000 m² commercial building HVAC system. This building, located in Northern Europe, was a real challenge:
- a recent (2015), awarded construction. It obtained the DGNB Platinum construction certification.
- a modern building management system (BMS), with fancy, state-of-the-art control sequences
- a low energy consumption baseload for the HVAC system:
32 kWh/m²·year
Within a few weeks, we rolled out the SAB HVAC optimization workflow:
- building characteristics and energy data collection, along with facility managers interview to get a better understanding of known pain points
- digital twin acquisition, by crafting a building model calibrated against actual building energy data
- smart agents training, by using the digital twin as safe, accurate training environment
This method allowed us, within a short time frame, to:
- present several optimization strategies, backed by solid energy savings estimates
- discuss and validate the best strategies
- design and apply a tailor-made test plan
After test plan was fully executed and initial results in line with expectations, our customer gave us the green light for 24/7 control.
Day 1 - a good slash
Our smart agents’ performance is monitored using opensource tools like Grafana, and aggregated performance Key Performance Indicators (KPI) are continuously computed to track savings, comfort and AQI over the course of several months and years.
In early fall, we gave our agents the go-live and watched🍿
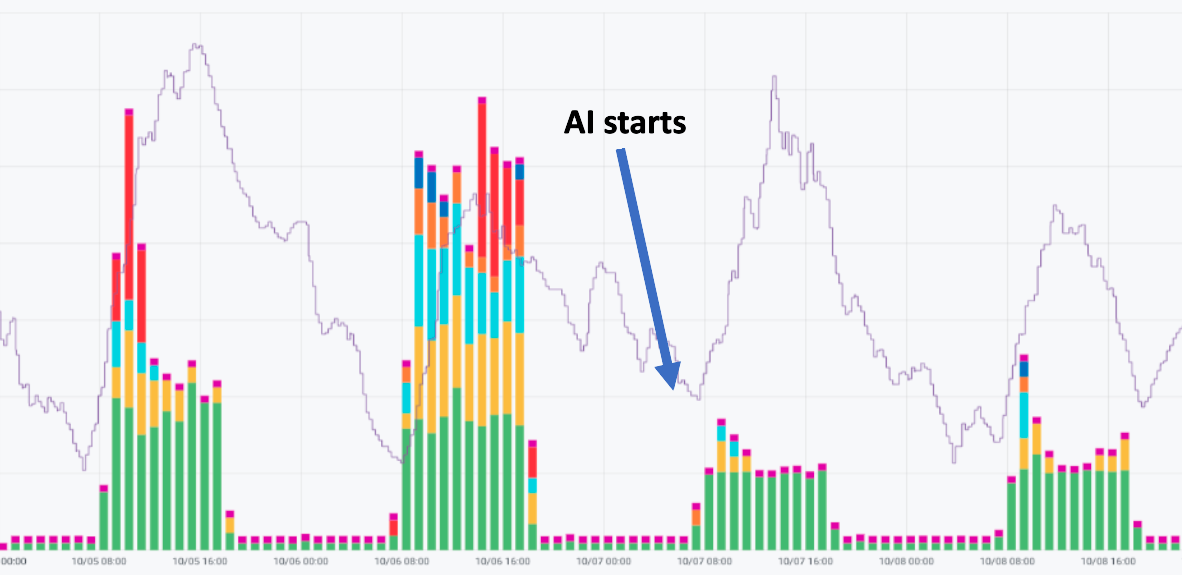
This day of October, there was a drastic cut in HVAC energy consumption. All HVAC energy uses (AHU electricity and per-floor heating, showed with different colors in stacked bars chart) were significantly reduced despite similar weather conditions compared to previous, non-SAB days.
What it demonstrated:
- HVAC was running at design conditions all the time. Air flow rate was too high for building heating and air renewal needs
- there was too much reheat at floor level. Supplied air temperature was too cold, leading to waste of heating at each floor
After 9 months
The first few days went good. But this isn’t enough to demonstrate efficiency of a solution. You need, … time.
Today, we release some key metrics that show how SAB agents did their job. Starting with the classic Energy v.s. Heating Degree Day scatter and linear regression.
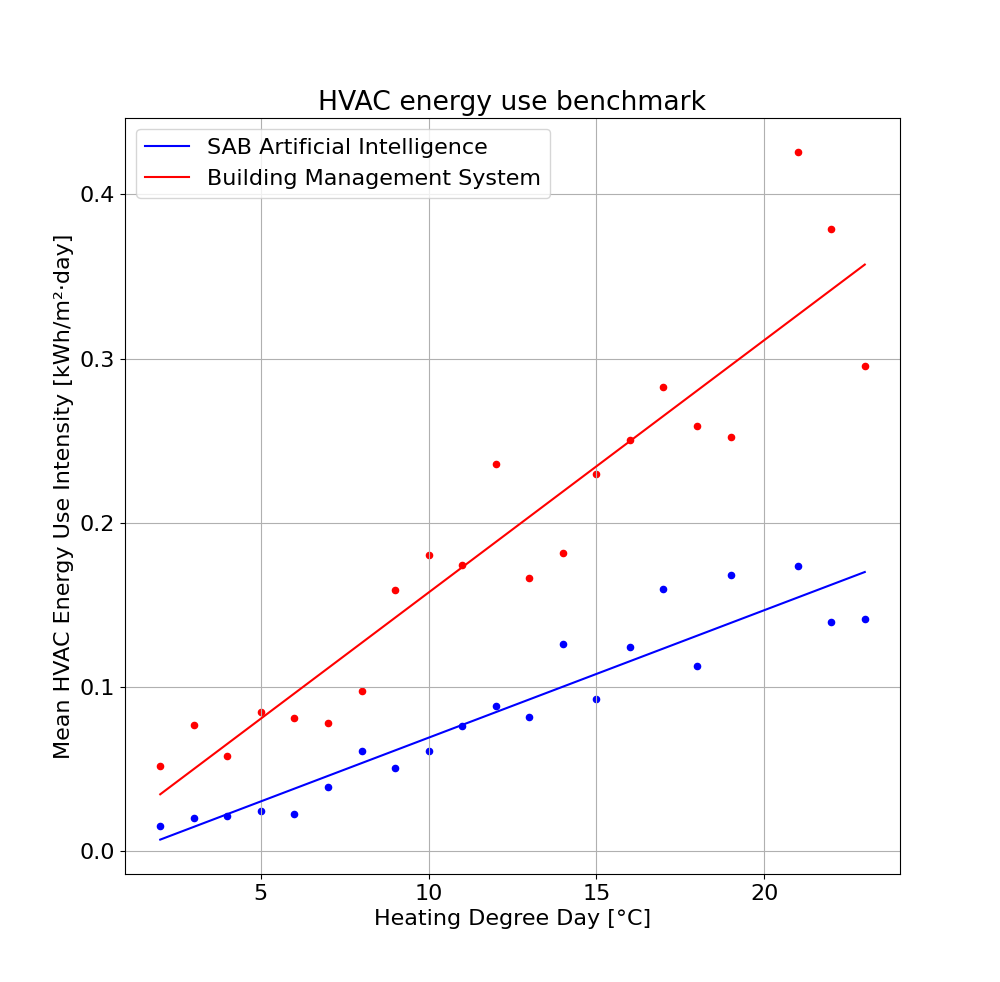
From this first chart, we see SAB is overperforming in every situation, mild or cold weather. The regression slope is steeper for the BMS as HDD increases; it can be interpreted as the HVAC sensitivity to weather, and SAB agents are much less sensitive than the BMS.
To get a better understanding on each method performance, we can use a piecewise regression (a.k.a segmented regression) to identify some patterns
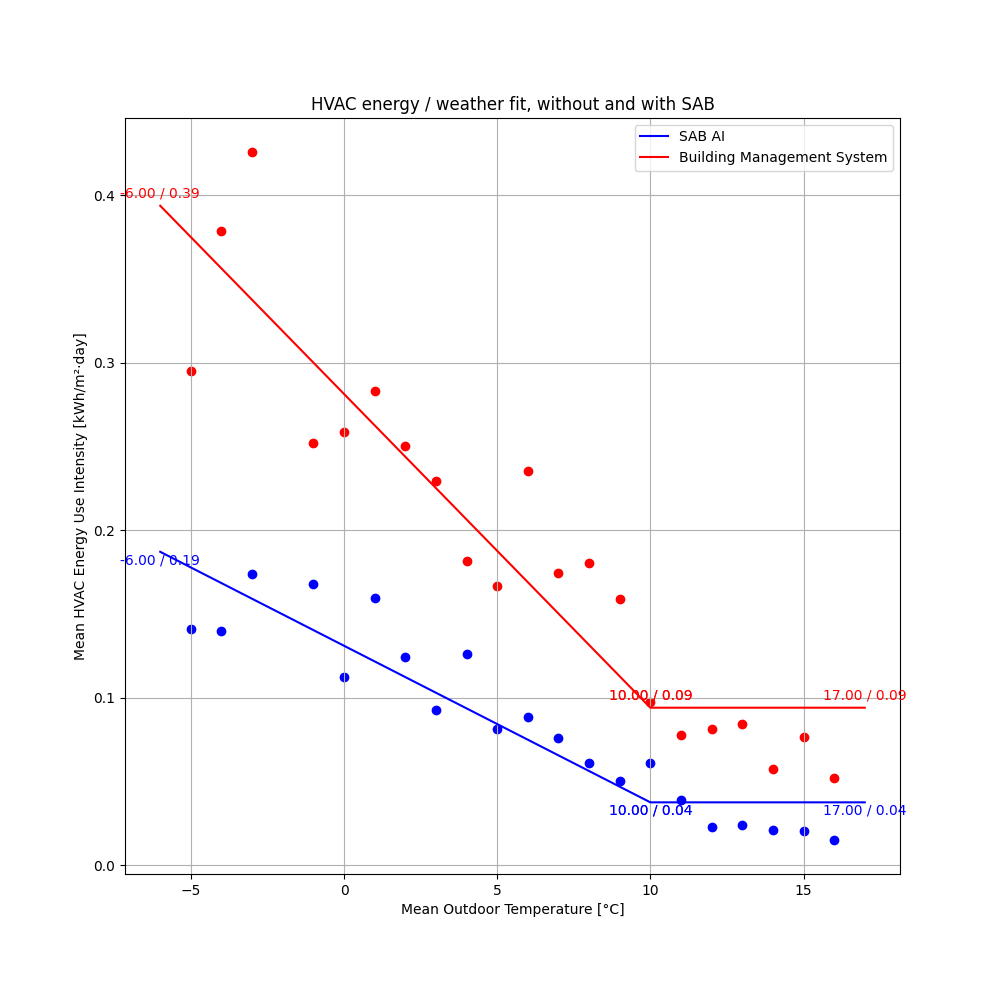
This time, x axis uses daily mean outdoor temperature. What we observe:
- Energy Use Intensity is confirmed smaller
- heating change point is close to same between BMS and SAB control, at about 10°C. This means that heating needs to kick in only when outdoor temperature is 10°C or below.
- baseload (horizontal part of the regression) is also improved with SAB: HVAC system, under optimal weather conditions, runs with less
Takeaways
The figure: a 54% cut in HVAC spending, with no compromise on thermal comfort or indoor air quality.
What we learned:
- every building is different, and every tenant has his/her own settings and preferences. You can advise to change set points and tell people to wear a sweater, or you can use a smart system. In present case, thermostat set points weren’t changed and are respected 98% of the time. Air quality is near perfect, with measured CO2 below 900ppm 100% of the time.
- a successful project requires solid foundations: by giving precise estimates and several optimisation choices to our customers, expectations are set. In present case, actual savings show a 5-10% error with estimates (for winter months, savings were estimated at 50%)
- visibility is key: we built an alerting and monitoring system that we and our customers use every day. It goes from standard HVAC health checks (like prescribed by ASHRAE guideline 36 for VAV systems) to tailor-made alerts, with auto-remediation, and real-time monitoring. All building sensors data, as well as KPIs, are visible to everyone involved in the project
- reactivity and security are not optional: if something goes wrong, you need to know it immediately and react as fast as possible. This leads to automating everything. As a consequence, all our control loops deployment pipelines are fully automated, isolated and secured.